GuidesMeasuring the impact of your videos

So you've just uploaded a video, now what? How should you track what's happening? This is where video analytics enters the picture.
There are four key terms when it comes to video analytics:
- Engagement & Engagment Graph
- Impressions
- Plays
- Finish
- Activities
Let's dig into each of these and decipher what these therms mean.
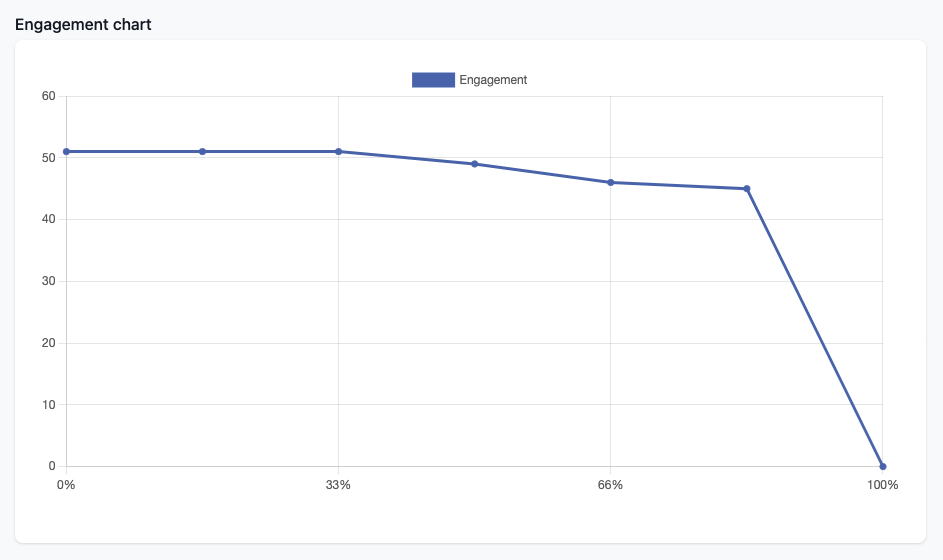
Engagement & Engagement Graph
Video engagement is the total watchtime of your video. This can be provided both as percentages or total number of hours/minutes/seconds.
The Engagement graph visualizes how much each segment has been viewed, the vertical axis is the number of views and the horizontal axis is the video progress in percentages.
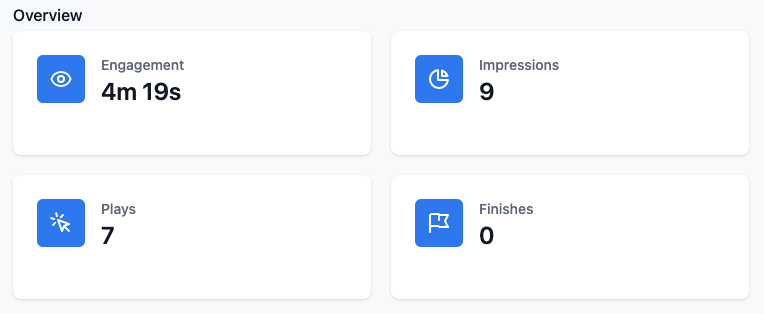
Impressions, Plays & Finishes
Impressions are the number of times your video thumbnail has been shown to a viewer. Note that the video might or might not have been played.
Plays are the number of times a play event was received, regardless of how much of the video was viewed.
Finishes are counted when 90% or more of a video is viewed.
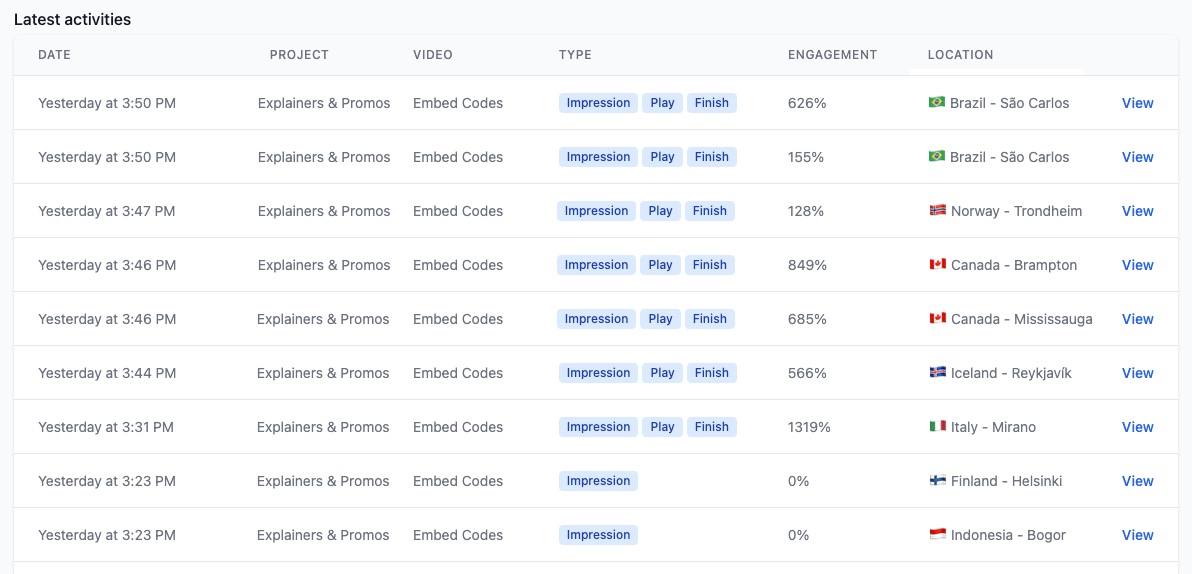
Activities
Activities are listed per video or per project, summarizing activities for all videos in the project.
The Activity List gives you all the necessary details for that specific Activity:
- Impression/Play/Finish
- Engagement
- Viewer Location